理解房地产市场时,最容易犯的错误之一,就是只看一个数据,然后认为它代表了整个市场。“平均成交价”尤其容易让人产生这种误解ã€最æ

Dated: March 10 2026
Views: 30
If you want to understand where the Oklahoma City metro housing market is moving next, don’t just watch closings. Watch showings.
Showings are one of the earliest indicators of real buyer interest. Before a home goes under contract, before negotiations start, and before a sale closes, a buyer usually has to show up. That is why the two graphs here matter so much. They show us where buyer attention is strongest right now by city and by price range.
And the takeaway is clear: the OKC metro market is becoming more price-sensitive and more local at the same time.
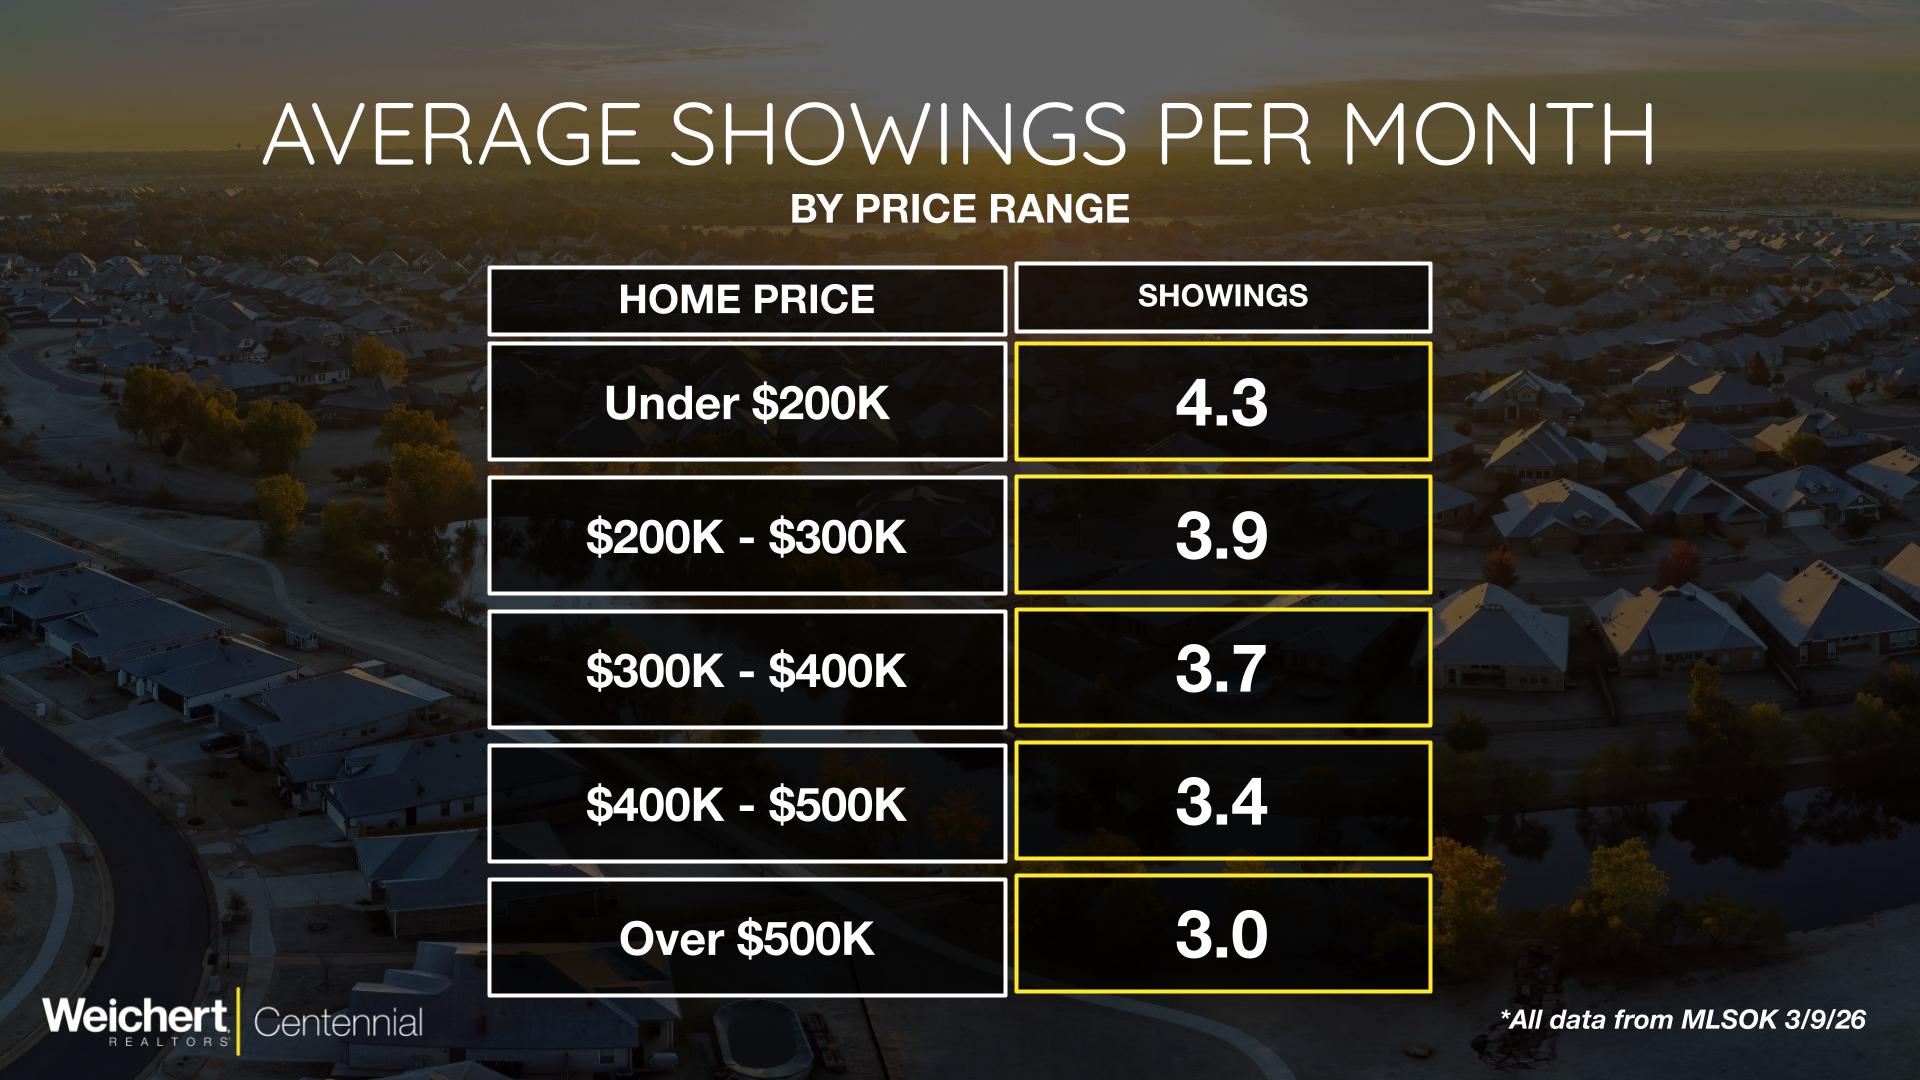
The first big trend comes from the price-range graph. Homes priced under $200,000 are getting the most monthly showings at 4.3 per month. After that, the numbers step down gradually:
$200K–$300K: 3.9
$300K–$400K: 3.7
$400K–$500K: 3.4
Over $500K: 3.0
This is not a dramatic collapse in activity at higher prices, but it is a very clear pattern. The lower the price, the more buyer traffic the average listing is getting.
That tells us two important things.
First, affordability is still driving a huge share of buyer behavior. That should not surprise anyone in a market where buyers are paying close attention to monthly payment, not just purchase price. Homes under $200,000 and in the low-to-mid price ranges naturally attract a bigger buyer pool.
Second, upper-end homes are still getting showings, just not at the same pace. A listing over $500,000 is not “ignored,” but it is competing for a smaller group of buyers. That means sellers in those higher brackets often need stronger presentation, better pricing, and more patience.
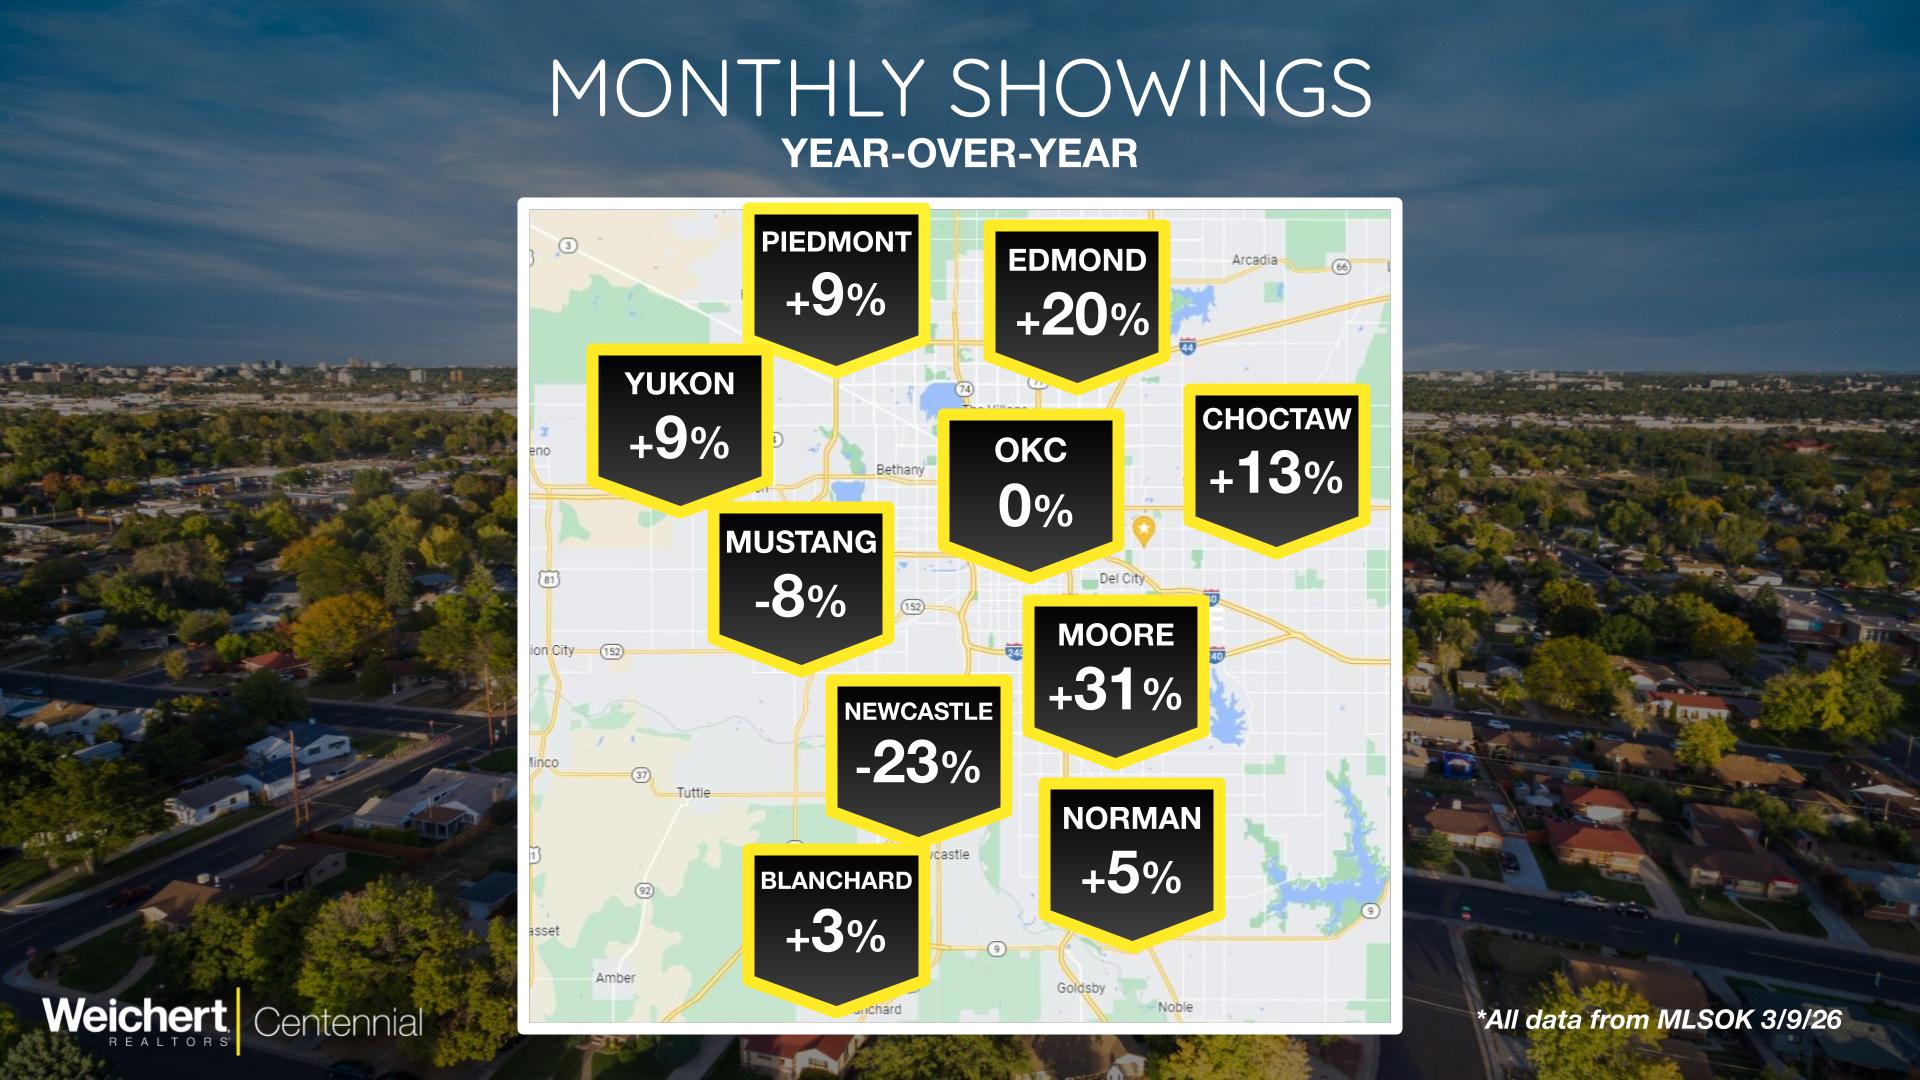
The second graph shows year-over-year change in monthly showings by city, and this is where the market gets more nuanced.
Some cities are seeing a noticeable increase in buyer attention:
At the same time, some cities are flat or down:
This is what makes the current market so important to interpret correctly. If someone says, “showings are up” or “buyers are slowing down,” both statements can be true depending on where you are.
For example, Moore is seeing a major jump in buyer traffic. Edmond is also showing strong year-over-year growth. That suggests those areas are getting more attention and potentially more competition than they were a year ago.
Meanwhile, Newcastle and Mustang are showing the opposite trend. That does not automatically mean those markets are weak, but it does mean sellers there may need to be more careful about pricing and positioning if they want to capture attention.
And OKC proper being flat is a story in itself. It suggests a market that has not accelerated like some suburbs, but also has not lost ground.
If you are selling, the biggest mistake you can make is assuming your home will get the same level of attention as every other property in the metro.
These graphs show that buyer demand is not evenly distributed. It depends heavily on price point and city.
If your home is in a hot attention zone, like a lower price bracket or a city with rising showings, you may have a stronger chance of generating activity quickly. But that does not mean you can overprice. Buyers may be looking, but they are still selective.
If your home is in a softer attention area or a higher price range, pricing and presentation matter even more. You may only get a few serious chances to make a strong first impression.
For buyers, this data is also useful.
If you are searching under $300,000, you are competing in the busiest traffic bands. That means attractive homes in that range may still move quickly even in a more normalized market.
If you are shopping higher up, especially over $500,000, you may have a little more breathing room. Fewer showings often means less urgency and potentially more negotiation leverage.
And city matters. A buyer looking in Moore may be stepping into a more competitive showing environment than a buyer looking in Newcastle.
The OKC metro is not one single market right now. It is a mix of micro-markets shaped by affordability, location, and buyer behavior.
The price-range data says buyers are gravitating toward lower-priced homes. The city data says some areas are gaining momentum while others are cooling off.
That combination matters. Because in real estate, attention often comes before action.
If you want to know where your home, neighborhood, or target price range fits into this picture, that is where local analysis becomes far more valuable than broad headlines.

With a passion for both people and design, I bring a unique perspective to real estate across the Oklahoma City metro. Whether you’re buying your first home, upgrading to fit your family’s....
One of the easiest ways to misunderstand the housing market is to look at one number and assume it tells the whole story.That is especially true with average sales price.The latest MLSOK data shows
One of the easiest ways to misunderstand the housing market is to look at one number and assume it tells the whole story.That is especially true with average sales priceThe latest MLSOK data shows
One of the easiest ways to misunderstand the housing market is to look at one number and assume it tells the whole story.That is especially true with average sales price.The latest MLSOK data shows
 Copyright© 2026 MLSOK, Inc. listing content is believed to be accurate but is not guaranteed. Subject to verification by all parties. The listing information being provided is for consumers personal, non?commercial use and may not be used for any purpose other than to identify prospective properties consumers may be interested in purchasing. This listing data is copyrighted and may not be transmitted, retransmitted, copied, framed, repurposed, or altered in any way for any other site, individual
and/or purpose without the express written permission of MLSOK, Inc. Information last updated on September 10, 2026 1:55 PM UTC
© 2026 OKC Metropolitan Association of REALTORS® (OKMAR). All rights reserved.
Disclaimer: All information deemed reliable but not guaranteed and should be independently verified. All properties are subject to prior sale, change or withdrawal. Neither listing broker(s) nor September 10, 2026 1:55 PM UTC shall be responsible for any typographical errors, misinformation, misprints and shall be held totally harmless.
Data last updated on September 10, 2026 1:55 PM UTC
Show More...
Copyright© 2026 MLSOK, Inc. listing content is believed to be accurate but is not guaranteed. Subject to verification by all parties. The listing information being provided is for consumers personal, non?commercial use and may not be used for any purpose other than to identify prospective properties consumers may be interested in purchasing. This listing data is copyrighted and may not be transmitted, retransmitted, copied, framed, repurposed, or altered in any way for any other site, individual
and/or purpose without the express written permission of MLSOK, Inc. Information last updated on September 10, 2026 1:55 PM UTC
© 2026 OKC Metropolitan Association of REALTORS® (OKMAR). All rights reserved.
Disclaimer: All information deemed reliable but not guaranteed and should be independently verified. All properties are subject to prior sale, change or withdrawal. Neither listing broker(s) nor September 10, 2026 1:55 PM UTC shall be responsible for any typographical errors, misinformation, misprints and shall be held totally harmless.
Data last updated on September 10, 2026 1:55 PM UTC
Show More...
