当大多数人关注房地产市场时,通常会先看“刚刚成交了什么;。成交数据当然很重要,但它本质上是回顾性的。它告诉我们,买家和卖家在几天

Dated: September 15 2026
Views: 36
When most people look at the housing market, they focus on what just sold.
Closed sales are useful, but they are also backward-looking. They tell us what buyers and sellers agreed to days or weeks ago. Current listings tell a different story. They show what buyers are choosing from right now, and they show how long sellers have already been waiting.
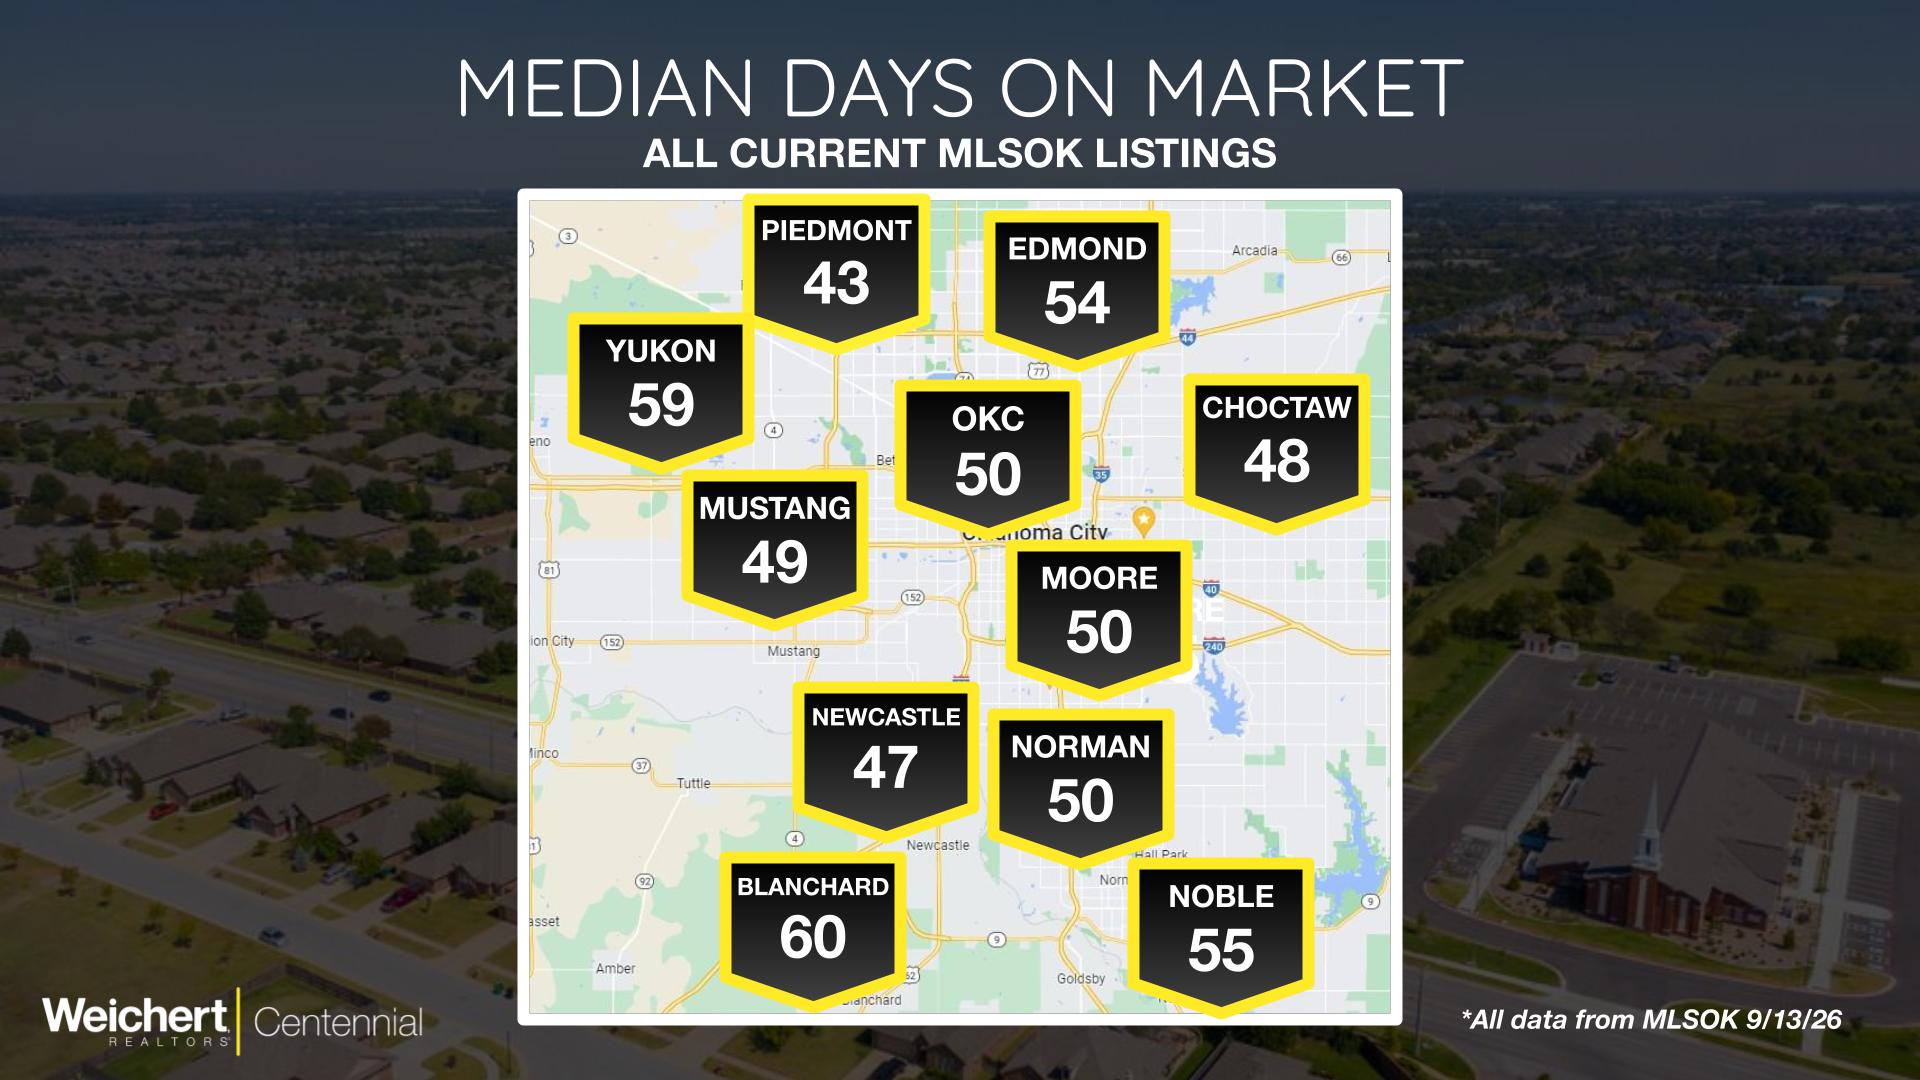
That is why these two MLSOK graphs are important. One shows the number of houses currently for sale in several OKC-area markets. The other shows the median days on market for those same current listings. Together, they give us a snapshot of the active competition sellers are facing today.
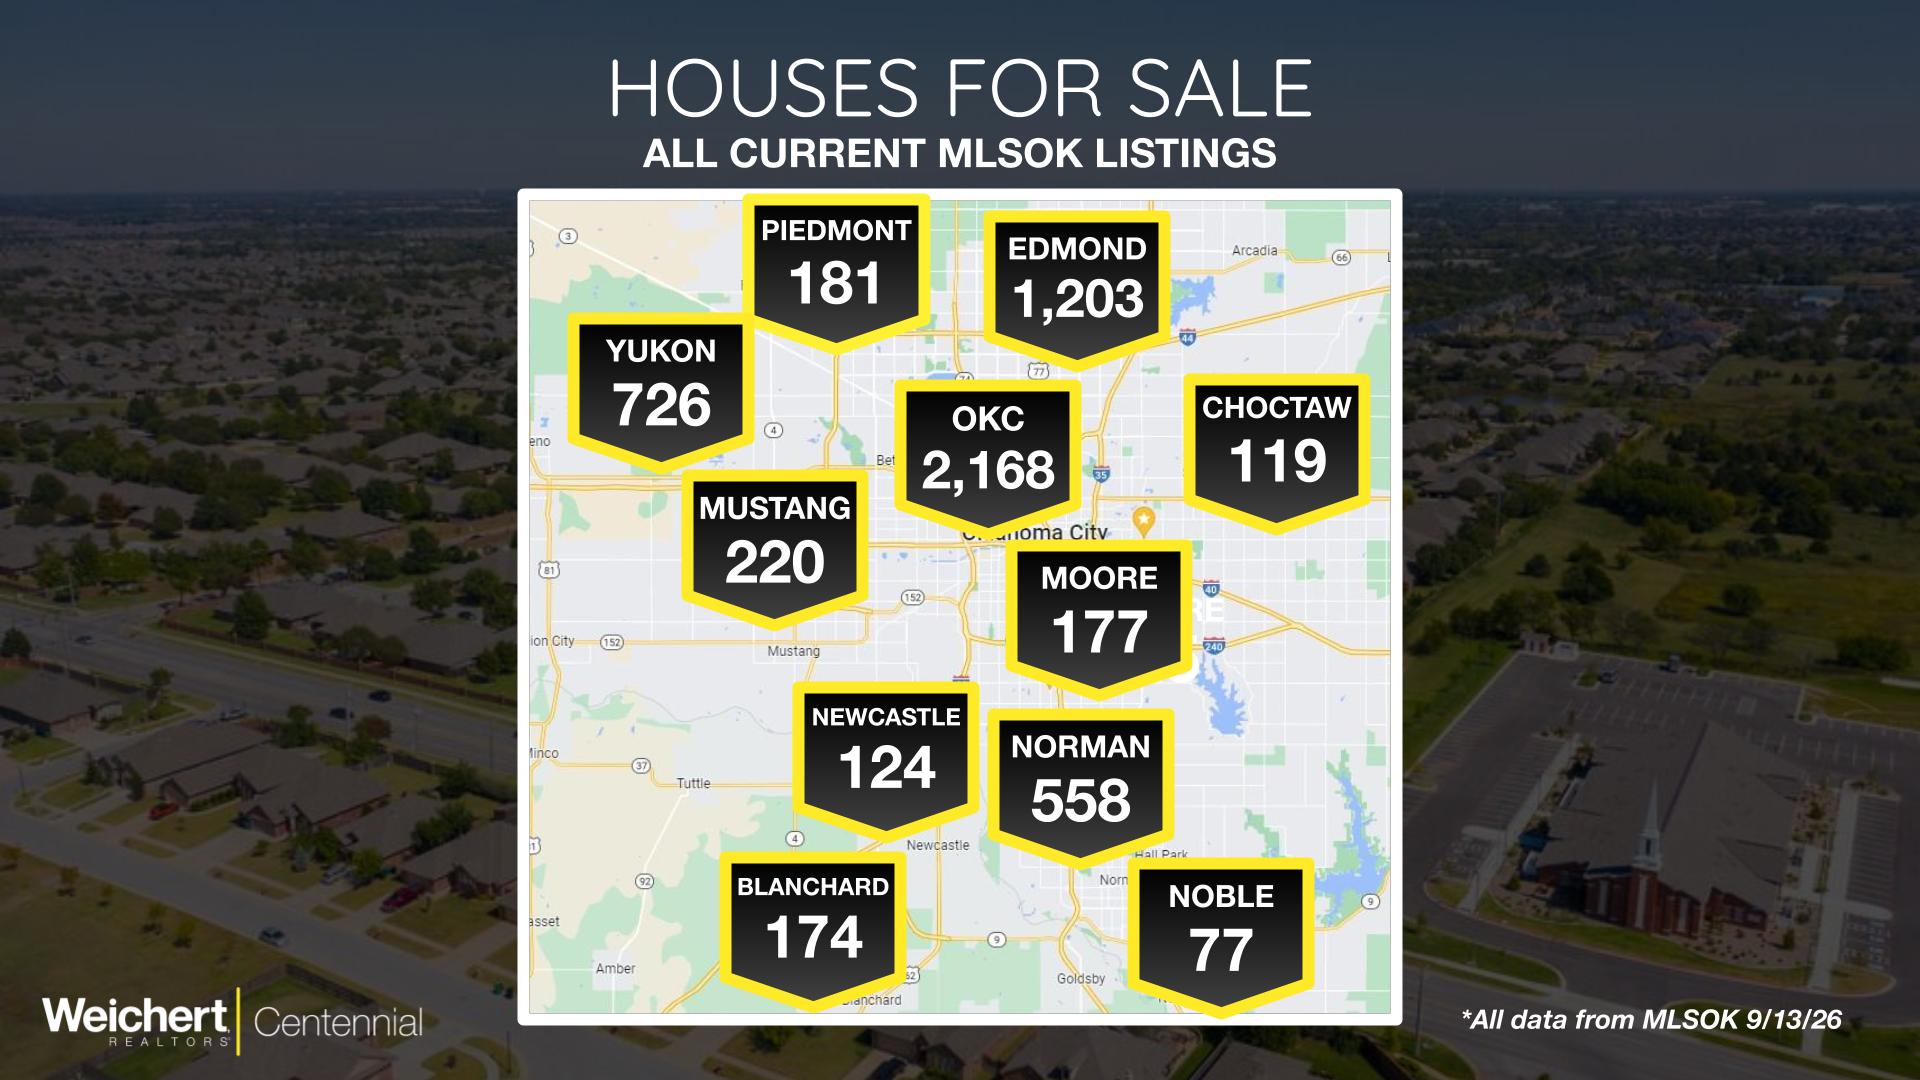
The first thing that stands out is the sheer number of available homes in the larger markets. Oklahoma City has 2,168 current listings, which is by far the largest number on the map. Edmond follows with 1,203 homes for sale. Yukon has 726, and Norman has 558.
Those four areas alone represent a lot of buyer choice.
That matters because buyers do not look at one home in isolation. They compare. They compare price, location, photos, updates, lot size, square footage, condition, school district, commute, and monthly payment. When a buyer has hundreds or even thousands of options in a broad market, every listing has to earn attention.
The smaller surrounding markets have fewer homes for sale, but still enough inventory to create meaningful competition. Mustang has 220 current listings, Piedmont has 181, Moore has 177, Blanchard has 174, Newcastle has 124, Choctaw has 119, and Noble has 77.
On the surface, a town with fewer listings might look easier for sellers. But that is where the second graph becomes important.
The median days on market chart shows how long current listings have already been sitting. This is not measuring how long recently sold homes took to sell. It is looking at the active listings still available, which means it can reveal where inventory may be aging.
Blanchard has the highest median days on market among the featured towns at 60 days. Yukon is close behind at 59 days, followed by Noble at 55 days and Edmond at 54 days. Oklahoma City, Moore, and Norman are all at 50 days, while Mustang is at 49, Choctaw is at 48, Newcastle is at 47, and Piedmont is the lowest at 43 days.
The interesting part is how close most of these numbers are. Nearly every featured market is sitting somewhere in the 40-to-60-day range for median days on market. That means the active inventory is not just fresh listings coming online. A large portion of the available homes have already been exposed to the market for several weeks.
That changes the way buyers and sellers should interpret the market.
For buyers, this kind of data may create opportunity. A home that has been sitting for 50 or 60 days may not automatically be overpriced or unwanted, but it does raise questions. Has the seller already made a price adjustment? Is the home competing against newer listings? Are there concessions available? Is the seller more motivated now than they were during the first week?
Those questions matter because days on market can influence negotiation. Buyers may have more room to compare homes, revisit listings they skipped earlier, or ask for terms that make the deal work better.
For sellers, the message is more urgent. A listing can get stale faster than many people realize. Once a home has been online for several weeks, it may start competing not only with new listings, but also with buyer perception. Buyers may wonder why it has not sold. Agents may assume there is more negotiating room. Other sellers may reduce prices or offer concessions, creating even more pressure.
This is where the idea of a listing’s “shelf life” becomes useful.
A home may technically be available for months, but its strongest attention often comes early. The longer it sits, the more important it becomes to understand why. Is it price? Condition? Photos? Access? Location? Competition? A seller cannot control every part of the market, but they can control how their home enters the market and how quickly they respond if the market gives them feedback.
The data also shows why local context matters. Edmond has a large number of current listings at 1,203 and a median DOM of 54 days. That means sellers in Edmond are dealing with both a deep pool of competition and active listings that have already been sitting. Piedmont, on the other hand, has 181 listings and the lowest median DOM on the map at 43 days, suggesting a somewhat faster-moving active inventory compared with the other featured towns.
Yukon is another market to watch. With 726 current listings and a 59-day median DOM, buyers there appear to have both meaningful selection and a lot of listings that have been available for nearly two months at the median.
The broader takeaway is that the current market is not just about how many homes are for sale. It is about how long those homes have been waiting for a buyer.
A high listing count tells us buyers have options.
A high median days on market tells us sellers may be facing patience, pressure, or both.
For anyone planning to buy or sell in the OKC area, this is the part of the market worth watching closely. Closed sales tell us where the market has been. Current inventory tells us where the competition is right now.
And right now, the active MLSOK market is showing a lot of available homes with a meaningful amount of time already on the clock.
Data from MLSOK, 9/13/26.

Hi, I’m Destinee Smith, and I help people buy and sell across the OKC metro!I got my start in real estate as the Director of Marketing for my brokerage. So when it comes to getting homes noticed....
When most people look at the housing market, they focus on what just sold.Closed sales are useful, but they are also backward-looking. They tell us what buyers and sellers agreed to days or weeks.
When most people look at the housing market, they focus on what just sold.Closed sales are useful, but they are also backward-looking. They tell us what buyers and sellers agreed to days or weeks.
When most people look at the housing market, they focus on what just sold.Closed sales are useful, but they are also backward-looking. They tell us what buyers and sellers agreed to days or weeks.
 Copyright© 2026 MLSOK, Inc. listing content is believed to be accurate but is not guaranteed. Subject to verification by all parties. The listing information being provided is for consumers personal, non?commercial use and may not be used for any purpose other than to identify prospective properties consumers may be interested in purchasing. This listing data is copyrighted and may not be transmitted, retransmitted, copied, framed, repurposed, or altered in any way for any other site, individual
and/or purpose without the express written permission of MLSOK, Inc. Information last updated on September 18, 2026 5:05 PM UTC
© 2026 OKC Metropolitan Association of REALTORS® (OKMAR). All rights reserved.
Disclaimer: All information deemed reliable but not guaranteed and should be independently verified. All properties are subject to prior sale, change or withdrawal. Neither listing broker(s) nor September 18, 2026 5:05 PM UTC shall be responsible for any typographical errors, misinformation, misprints and shall be held totally harmless.
Data last updated on September 18, 2026 5:05 PM UTC
Show More...
Copyright© 2026 MLSOK, Inc. listing content is believed to be accurate but is not guaranteed. Subject to verification by all parties. The listing information being provided is for consumers personal, non?commercial use and may not be used for any purpose other than to identify prospective properties consumers may be interested in purchasing. This listing data is copyrighted and may not be transmitted, retransmitted, copied, framed, repurposed, or altered in any way for any other site, individual
and/or purpose without the express written permission of MLSOK, Inc. Information last updated on September 18, 2026 5:05 PM UTC
© 2026 OKC Metropolitan Association of REALTORS® (OKMAR). All rights reserved.
Disclaimer: All information deemed reliable but not guaranteed and should be independently verified. All properties are subject to prior sale, change or withdrawal. Neither listing broker(s) nor September 18, 2026 5:05 PM UTC shall be responsible for any typographical errors, misinformation, misprints and shall be held totally harmless.
Data last updated on September 18, 2026 5:05 PM UTC
Show More...
